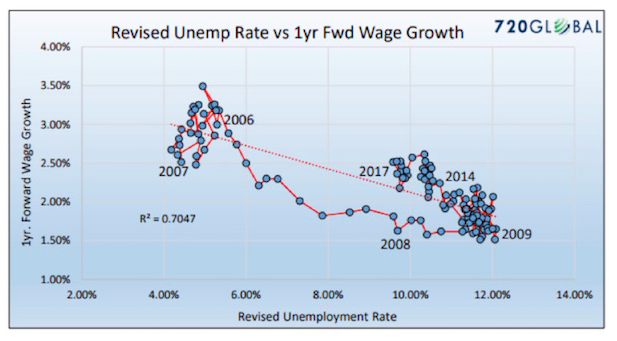
Both graphs … demonstrate that only 28.84 percent of the change in wages was due to the change in the unemployment rate. Visual inspection [of the first graph] also tells you the relationship between wages and unemployment is weak. It is this graph that has many economists declaring the Phillips curve to be irrelevant. The second graph has a (warning: economic geekspeak) statistically significant R² of .7047 and a visible confirmation that the Phillips curve relationship continues to hold. Recently, Federal Reserve Bank of Chicago President Charles Evans stated, in relation to the Phillips curve, “We don’t have a great understanding of why it’s gotten to be so flat.” Mr. Evans, perhaps employment is not as strong as you and your Fed colleagues think it is.
720 Global goes on with more math before they produce this important graph:

If one believes that the laws of supply and demand continue to hold true, then the revised Phillips curve graph above argues that the unemployment rate is in reality much closer to 9 percent than 4.1 percent. To believe that the Phillips curve is useless, one must be willing to ignore a more rigorous assessment of labor market and wage data. The only reason economists and Fed officials voluntarily ignore this data is that it belies the prettier picture of the economy they wish to paint.


