


After decades during which employers usually held the upper hand, something feels different in the U.S. labor market. Wages are rising across the income spectrum. Workers are quitting in huge numbers. McDonald’s franchisees are offering hourly workers childcare and college tuition.
The Covid-19 pandemic and the unprecedented government aid in response to it are clearly part of the explanation for this, but it may also be relevant that the working-age population stopped growing a couple of years ago.
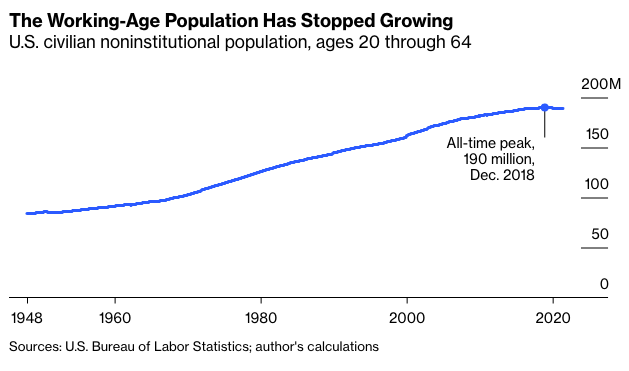
Definitions of “working-age” vary. In Bureau of Labor Statistics lingo it means everybody 16 and older, while international statistics-keepers such as the Organization for Economic Cooperation and Development and World Bank tend to define it as ages 15 through 64. I think the metric I’ve chosen—ages 20 through 64—better reflects who’s actually available to work in the U.S., given that it includes every age group with a labor-force participation rate above 50% and excludes all those for which it is lower.
Here’s the same data represented in terms of annual percentage change, which makes clearer what an historic shift we’re going through.
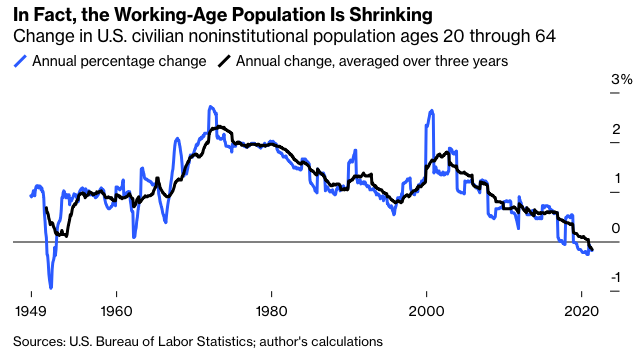
Changes in Census Bureau population estimates are responsible for most of the volatility in the non-smoothed line above. The sharp drop in both lines in the early 1950s can be explained by the big rise during the Korean War in the number of uniformed military personnel, who are removed from the population count for labor-statistics purposes (as are prison inmates and other institutionalized people). The Vietnam War also seems to have slowed growth in the 1960s, although as the famously numerous baby boomers started turning 20 in 1966 they overwhelmed its effects.
The oldest of the boomers are turning 75 this year and the youngest 57, so their entrance into the 65-and-older ranks has been depressing the growth of the 20-64 population for a decade now. The Census Bureau’s latest population projections, made in 2017, foresaw a modest rebound in the growth rate after the boomers finished aging out, but still much slower growth than seen in the 1950s through mid-2010s.
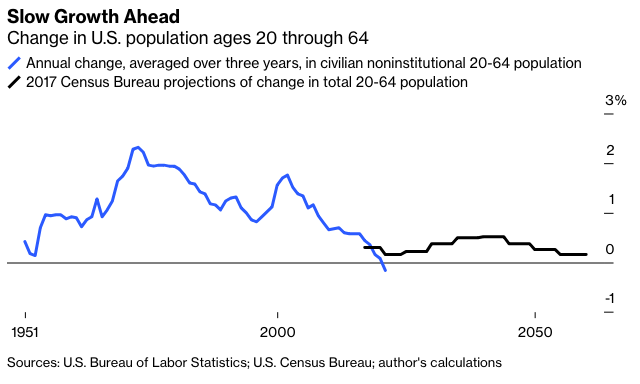
As is apparent from the chart, reality has already undershot the projections. That would seem to be due mainly to a slowdown in legal immigration during the Trump administration that turned into a near-shutdown in the first few months of the pandemic. Growth will likely continue to undershoot the projections in coming decades—barring a big increase in immigration—because birth rates have fallen faster than foreseen. The estimated 3.6 million babies born in the U.S. in 2020 was the lowest total since 1979, and given that the rate of decline increased as last year progressed, births this year will likely be even fewer.
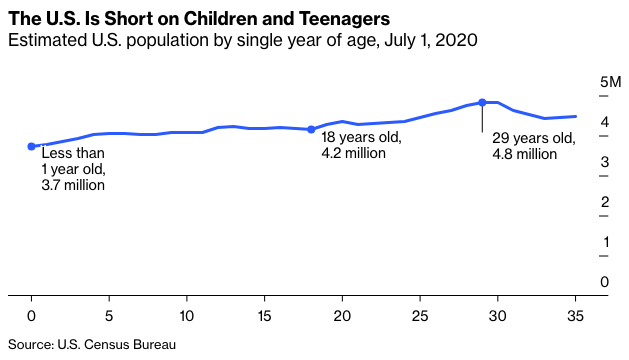
That U.S. population growth has slowed isn’t exactly news. The shrinking of the 20-through-64 population since the end of 2018 has gotten less attention, which is not surprising given that hardly anybody keeps track of the 20-through-64 population (I had to subtract the BLS’s 65-and-older population estimate from its 20-and-older estimate to get the numbers). The more closely watched “prime age” population of those 25 through 54 started shrinking in 2008, a few years after the baby boomers started turning 55, resumed growth in the mid-2010s as the most-populous part of the millennial generation turned 25, and appears destined to fluctuate within a narrow band for the next few years.