


As evidenced by S&P’s SPIVA reports, actively managed equity mutual funds persistently underperform. Their persistent underperformance has continued despite decreasing expense ratios and the increased share of index funds—active managers have argued that an increased market share of index funds would lead to market inefficiency due to less price discovery. As a result of their continued poor performance from 2006 through September 2021, active funds experienced outflows of about $2.20 trillion. In contrast, index equity mutual funds and exchange-traded funds (ETFs) together received about $1.5 trillion of cumulative net inflows.
James Xiong, Thomas Idzorek and Roger Ibbotson, authors of the study "The Diminishing Role of Active Mutual Funds: Flows and Returns," published in the Journal of Investment Management (Vol. 21, No. 4, 2023), examined the performance and fund flows of actively managed U.S. funds over the past 30 years. Their universe of U.S. domestic equity funds included 4,638 active mutual funds, 350 index mutual funds and 528 passive ETFs. They limited their analyses to funds that had AUM of $5 million as of January 2006 dollars to mitigate incubation bias. AUM minimums in other months were inflation adjusted by using the U.S. CPI-U Index. The corresponding AUM minimum was $3.4 million in January 1991 and $6.9 million in September 2021. Monthly percentage flows for each fund were restricted to between −50% and 100% to avoid outliers and potentially incorrect data.
They used four methods to estimate alphas:
(1) Simple Alpha, defined as a fund’s return over its Morningstar assigned benchmark return (such as Russell 1000 Growth Index return).
(2) FFC Alpha, defined from the Fama-French and Carhart Four-Factor Model.
(3) IDX4 Alpha, defined from a less biased FFC Model—The Index-Based Four-Factor Model as documented in the study "Should Benchmark Indices Have Alpha? Revisiting Performance Evaluation."
(4) IDX3 Alpha, defined from the Index-Based Three-Factor Model, formed by removing the momentum factor from the IDX4 model. Their objective was to answer four questions:
1. What has been the performance (gross and net alphas) for active and passive funds in the most recent 15+ year period?
2. How did small AUM active mutual funds’ performance compare to large AUM active mutual funds?
3. How did fund flows influence performance for active mutual funds? When funds experience immediate large outflows, liquidity is low and trading costs can be high, dragging down performance. Conversely, funds experiencing large inflows can create upward price pressure on stocks helping funds to earn abnormal returns (the impact has nothing to do with skill).
4. What is the future of active mutual funds?
While the first three answers are empirical in nature, the fourth involves extrapolating from the empirical observations into the future. Following is a summary of their key findings:
• The number of funds increased dramatically from 533 as of January 1991 to a peak of 2,313 in December 2006, and then fell to 1,618 by the end of September 2021.
• The AUM-weighted performance remained similar over time with index funds outperforming on a net return basis. However, equal-weighted performance (which emphasizes small AUM active funds) has deteriorated.
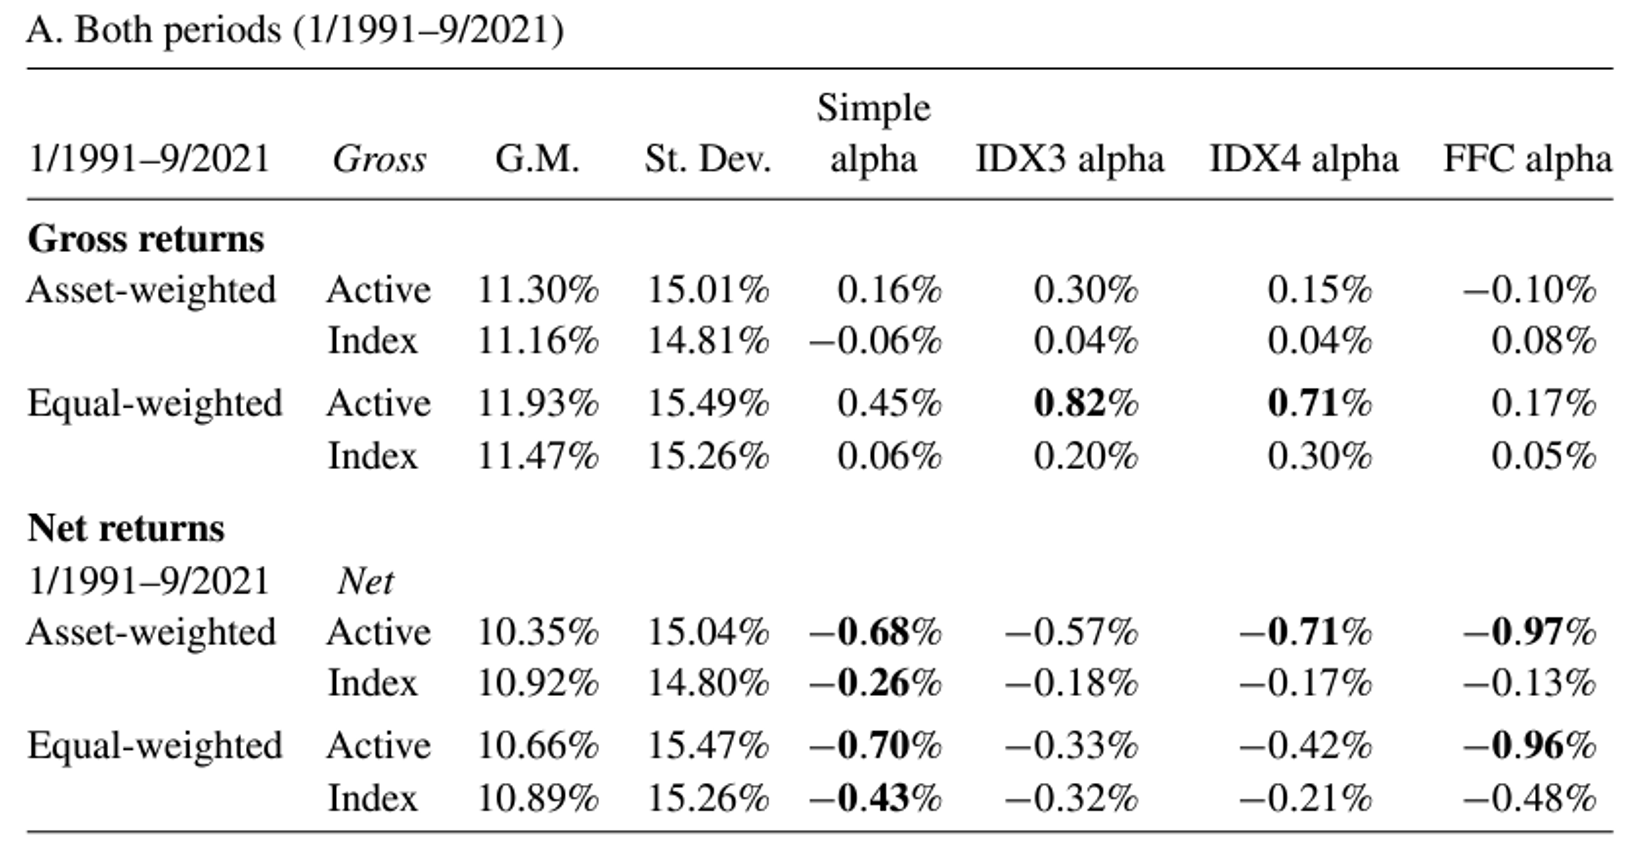
• The four measures of net alphas showed largely consistent (poor) performance.
• Expense ratios largely explained the differences between gross and net returns for both active and index funds.
• Active funds outperformed index funds on equal-weighted gross alphas during the internet bubble burst and the GFC, but underperformed index funds during the COVID crisis. Overall, the outperformance of active funds during crisis in the first half of the period virtually disappeared (just 0.10%) in the second half.
• Liquidity was lower and price impact was greater in bad markets.
• Small AUM funds outperformed large AUM funds in the first period, but slightly underperformed in the second period. The excess performance that small AUM funds enjoyed over the first period disappeared over the second period—consistently reduced flows were associated with deteriorated performance of the small AUM funds.
• The percentage of active funds with statistically significant alphas (>2) had fallen from 9.39% in the first half, to just 1.74% in the second half (and that is before taxes)—it’s becoming increasingly difficult to select outperforming funds.
• Inflows/outflows contributed to the over/under performance of individual active funds—the flow-impact on annualized alpha for aggregated active funds industry was a positive 0.33% between January 1991 and December 2005, but was a negative -0.10% between January 2006 and September 2021.
• If the current flow trend continues, the AUM of active mutual funds will drop to 17% of the total AUM of equity funds after 15 years. A simple linear fit of the trend over the complete time period suggests that the active mutual funds will almost disappear relative to passive funds approximately by 2051.
Their findings led Xiong, Idzorek and Ibbotson to conclude: “The fee difference of about 70bps between active and index funds may shrink, but is not expected to disappear, continuing to drag down the net performance and drive the persistent outflows from active mutual funds”—creating a vicious circle for active funds.
Investor Takeaways
In our book "The Incredible Shrinking Alpha," Andrew Berkin and I provided five explanations for the increasing difficulty active managers have been experiencing in their efforts to generate alpha.
1. The development of asset pricing models reduced the available sources of alpha as academics converted what was once alpha into beta (systematic source of returns).
2. The pool of victims (naive retail investors and unskilled active fund managers) that active managers can exploit to generate alpha has been shrinking.
3. The paradox of skill: The level of skill of active managers has increased making it more difficult to generate alpha because as average skill increases, it becomes more difficult to outperform by significant margins.
4. Successful active management contains the seeds of its own destruction due to diseconomies of scale.
5. The amount of assets chasing the shrinking pool of sources of alpha (for example, hedge fund assets have grown from about $300 billion to more than $5 trillion) and the shrinking pool of victims to exploit increases the hurdles to generate alpha.
Xiong, Idzorek and Ibbotson’s findings on the negative effect on performance of outflows provides a sixth hurdle.
Given the poor performance of actively managed funds, it is logical to expect that we will continue to see net outflows. The research demonstrates that outflows have significant negative impact on returns. Thus, we should expect the negative outflows will continue to exert a negative feedback loop on the active fund industry: “Bad net performance → outflows →additional negative performance due to flow impact → more outflows.”
Note that the increase in index investing’s share of assets, combined with the reduction in bid-offer spreads (which led to the virtual disappearance of market makers as the incentive to take positions fell) has led to market impact costs increasing—the markets have become more inelastic. The result is that the negative impact from outflows from active funds is only likely to increase as indexing’s share of assets increases.
Larry Swedroe is the author or co-author of 18 books on investing, including his latest, Enrich Your Future: The Keys to Successful Investing.